Saved Bookmarks
| 1. |
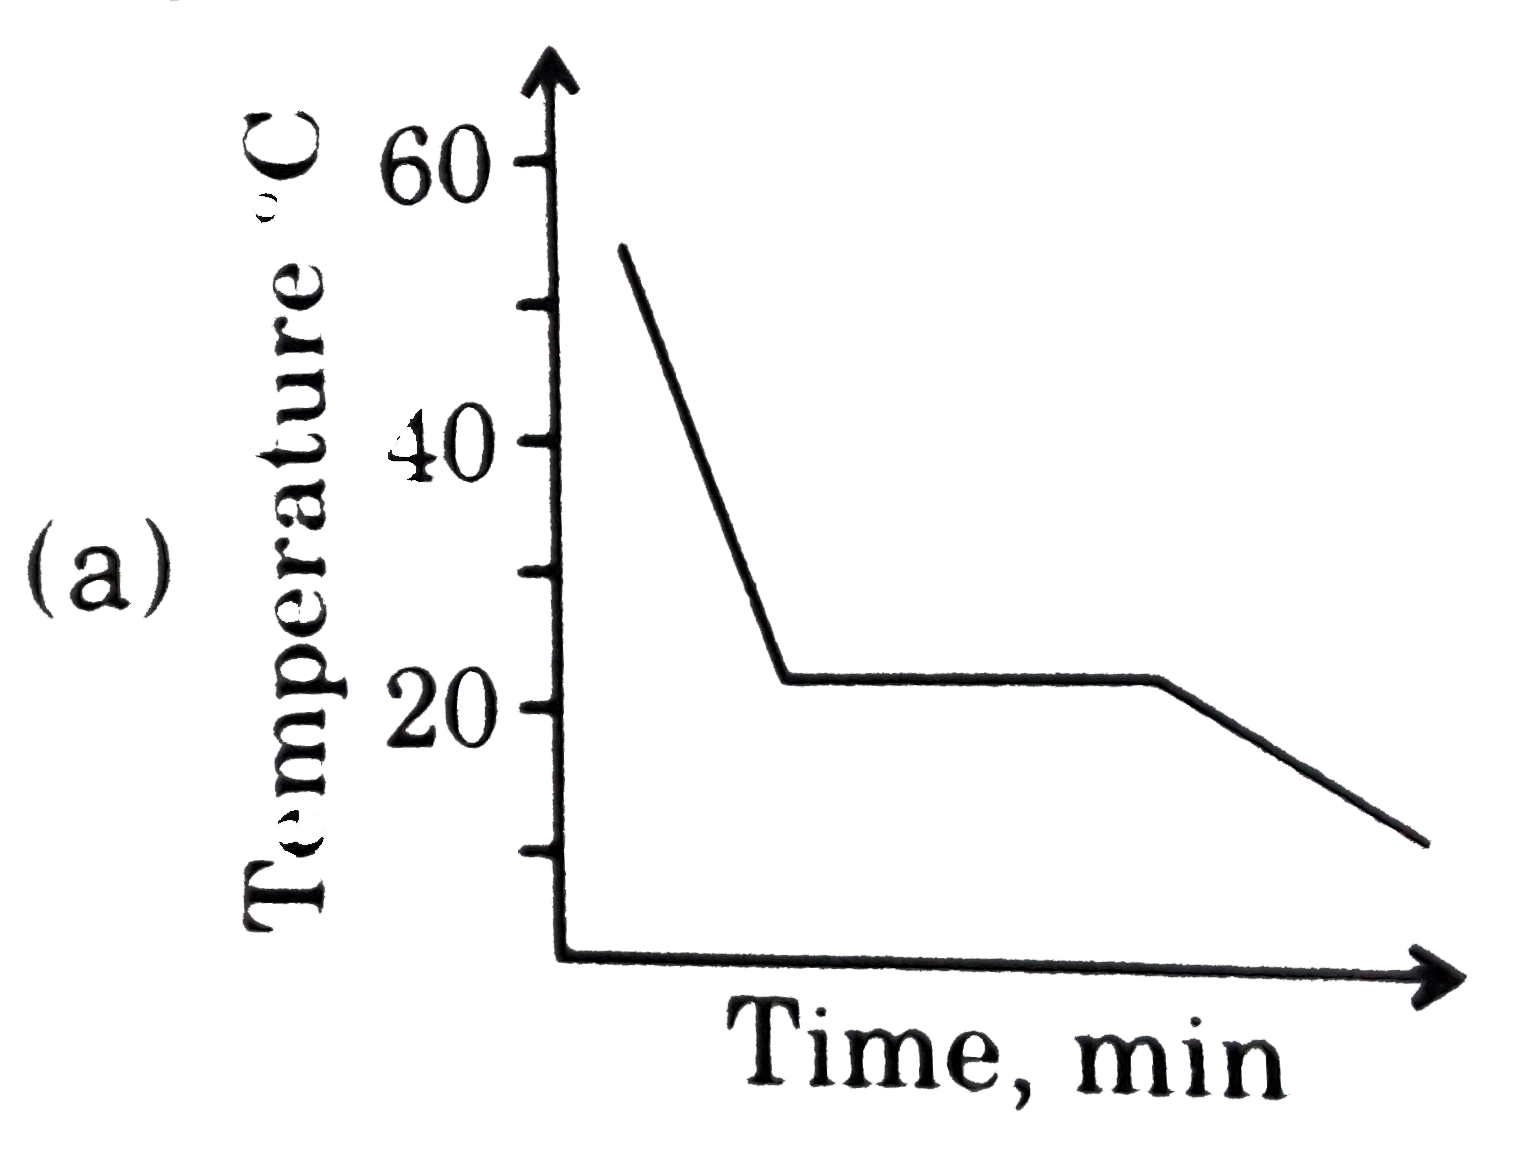
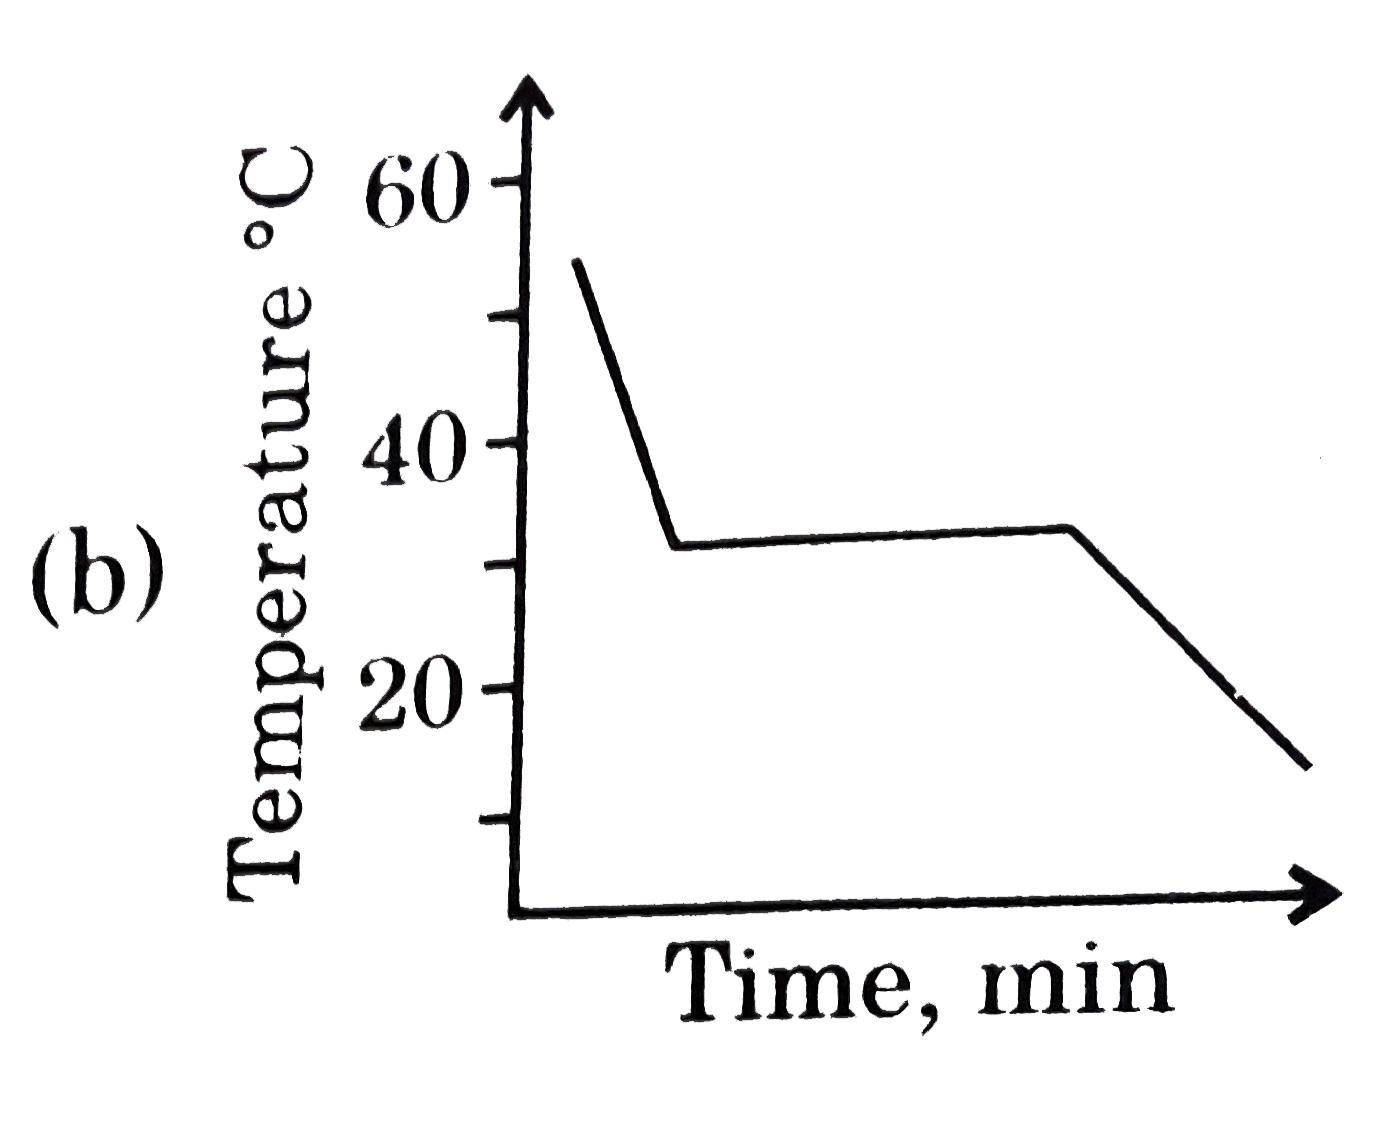
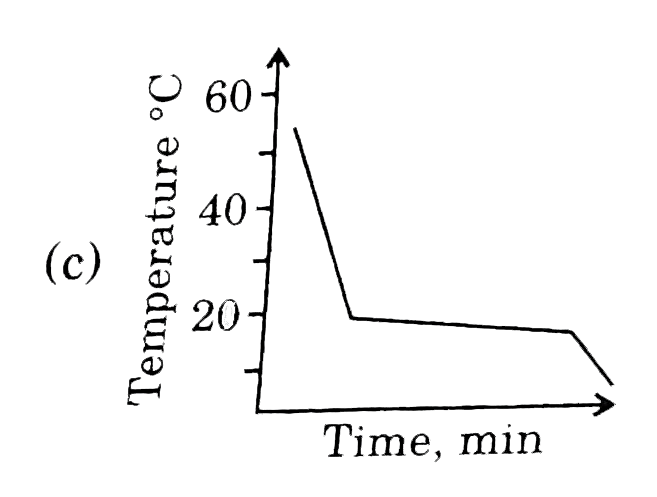
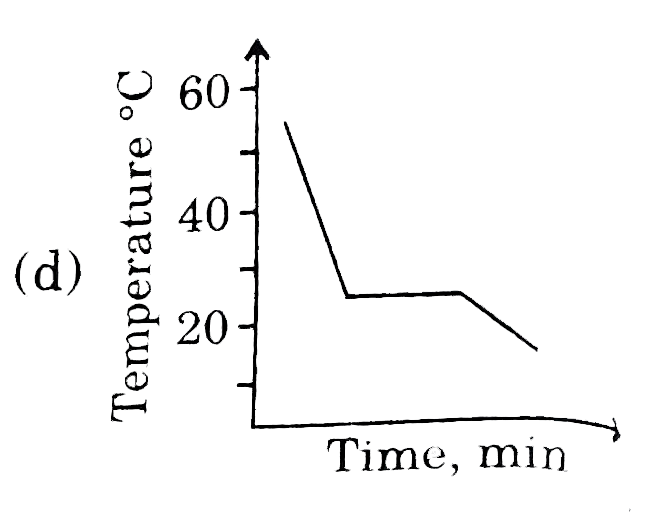
This diagram represents the behaviour of a pure solvent upon cooling. Which of the diagrams below best represents the cooling curve of a solution in that solvent upon cooling ? (Assume that all diagrams are drawn to the same scale.) |
|
Answer»
|
|