Saved Bookmarks
| 1. |
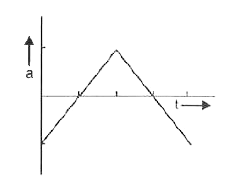
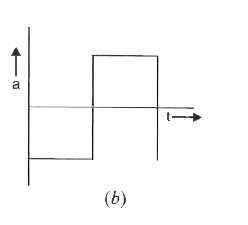
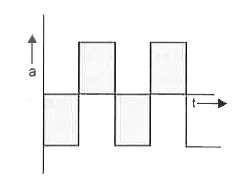
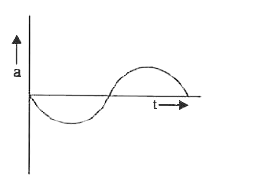
The graph shown in Fig. shows the velocity v tk versus time for a body, Which of the graphs shown below represents the corresponding accelera-tion versus time graphs ? |
|
Answer»
|
|