1.

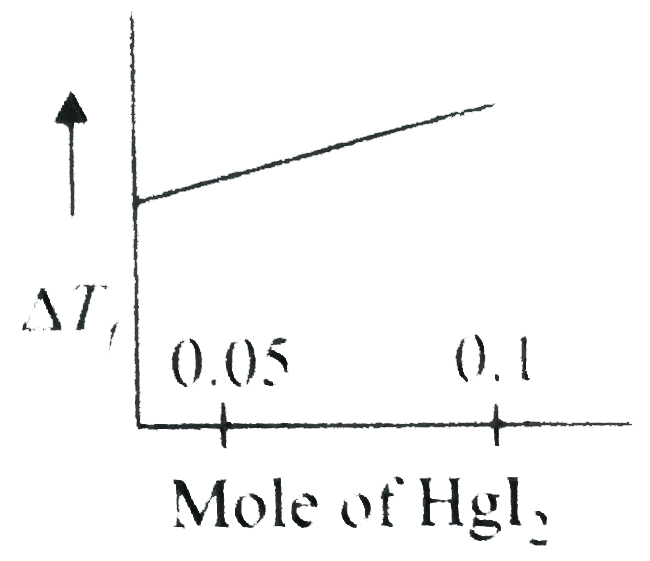
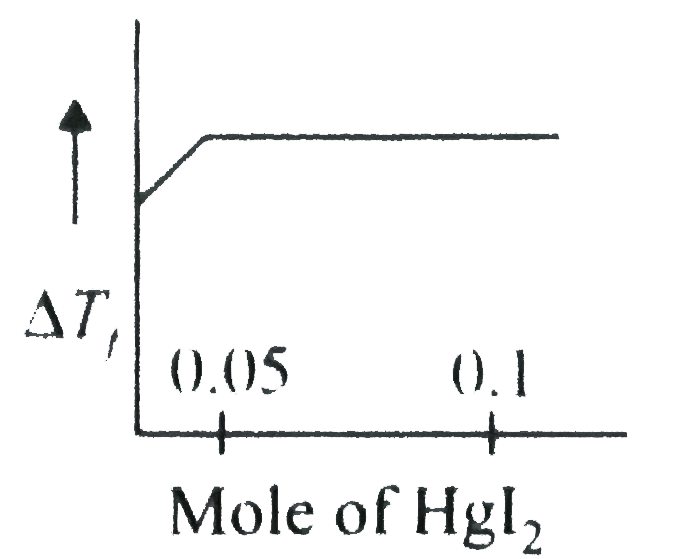
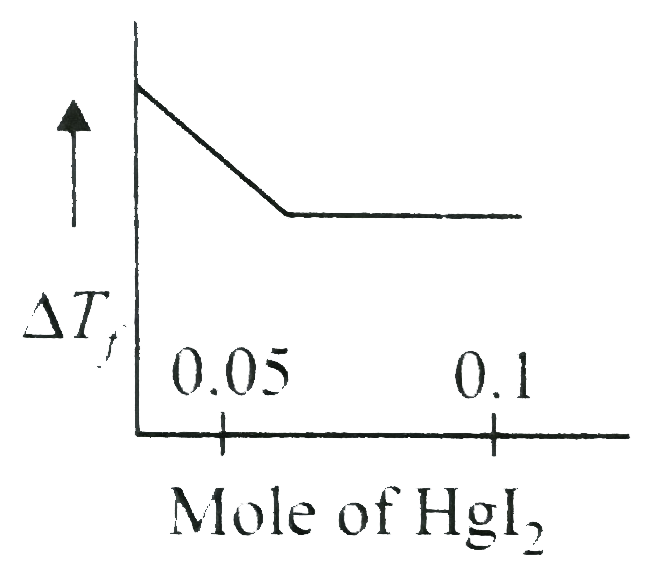
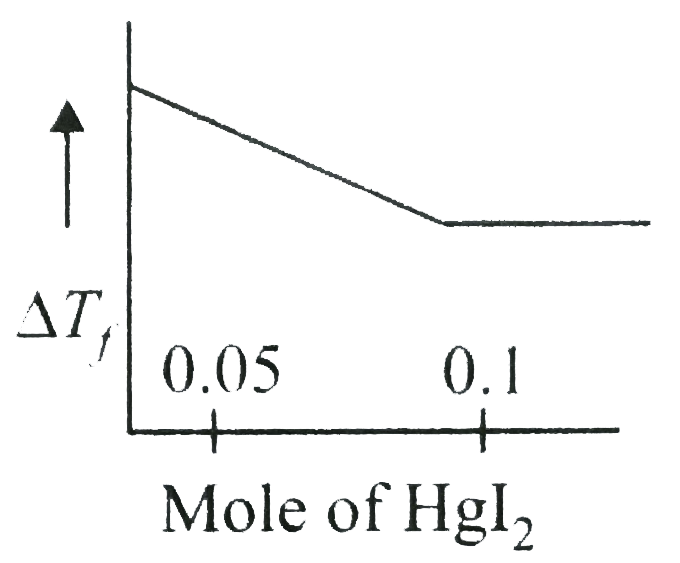
Increasing amoutn of HgI_(2)is added to 1 litre of an aqueous solution containing0.1mole of KI.Which of the following graphs does represent the variation of depression in freezing point of the resulting solution with the amount of HgI_(2)added?

Answer»


Solution :`2KI_(aq)+HgI_(2(s))rarrK_(2)HgI_(4)(aq)or2K^(+)+2I^(-)+HgI_(2(s))rarr2K^(+)+[HgI_(4)]^(2-)` As a RESULT of complex ion formation, THENO. Of mole particles in the solution decreases in the RATIO `4:3`So`DeltaT_(f)`decreases until all the `I^(-)` ions are consumed with`0.05` moles of `HgI_(2)`. The excess of `HgI_(2)`remain insoluble .Hence after `0.05`moles of `HgI_(2)`, the `F.P.` of solution REMAINS constant.


Discussion

No Comment Found