Saved Bookmarks
| 1. |
Explain with diagram , the relationship between TU and MU. |
Answer» Solution :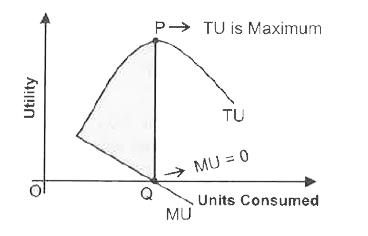 (i) When MU DECREASES, TU INCREASES at a diminishing rate. ( As shown in figure till consumption level OQ ). (II) When MU is zero , TU is constant and maximum at P. (iii) When MU is negative , TU starts diminishing. |
|