

Saved Bookmarks
| 1. |
Draw and explain the v to tgraphs for uniformly accelerated motion. |
Answer» Solution :Velocity-time graph for MOTION with CONSTANT acceleration are as following: 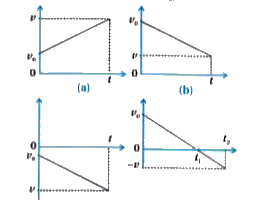 An object is moving in a POSITIVE direction with a positive acceleration, then graph (a) is obtained An object is moving in positive direction with a negative acceleration, then graph (b) is obtained. An object is moving in negative direction with a negative acceleration, then graph (c) is obtained. An object is moving in positive direction till time `t_(1)` and then turning back and moving with the same negative acceleration. This is shown in graph (d). An interesting feature of a velocity-time graph for any moving object is that the area under the CURVE represents the displacement over a GIVEN time interval. |
|