Saved Bookmarks
| 1. |
Draw a less than cumuative frequency curve (ogive) for the following distribution : |
Answer» Solution :The cumulative frequecny table for the given DISTRIBUTION is : 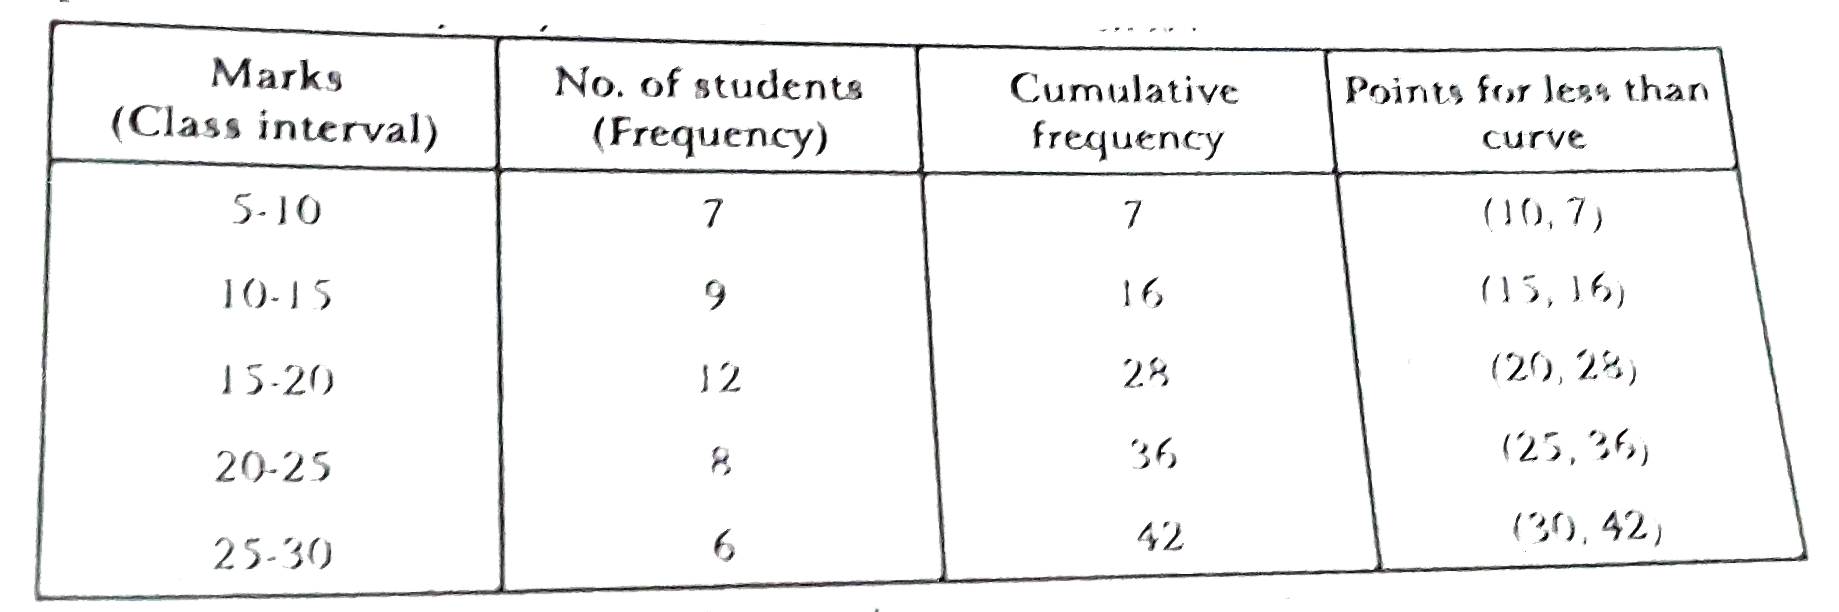 WIDTH="80%"> LTBR Taking upper class limits along X-axis and corresponding cumulative frequencies along Y-axis mark the points (10,7), (15,16), (20,28),(25,36) and (30,42). Join the points marked by a free hand curve (as shown in figure) WIDTH="80%"> LTBR Taking upper class limits along X-axis and corresponding cumulative frequencies along Y-axis mark the points (10,7), (15,16), (20,28),(25,36) and (30,42). Join the points marked by a free hand curve (as shown in figure) `(#NTN_MATH_X_C14_S01_033_S02.png" width="80%"> |
|